Biometrics is the measurement and statistical analysis of people’s unique physical and behavioral characteristics. The technology is mainly used for identification and access control or for identifying individuals who are under surveillance. The basic premise of biometric authentication is that every person can be accurately identified by intrinsic physical or behavioral traits. The term biometrics is derived from the Greek words bio, meaning ”life”, and metric, meaning ”to measure” [1].
Biometric modalities are methods of identifying individuals using unique physical or behavioral characteristics. These modalities are broadly classified into two categories: physiological and behavioral. Physiological biometrics include features such as fingerprints, facial features, iris and retina patterns, and palm prints. Behavioral biometrics, on the other hand, encompass traits related to actions or behaviors, like touch screen interaction, hand-waving patterns, keystroke dynamics, gait, signature, voice, and overall behavior profiling. Each modality has its own advantages and applications within the realm of personal security and authentication.
Gait as a Biometric Modality
With the growth in smartphone use as well as wearables [2], a relatively new Behavioral biometry is gaining popularity: a smartphone-based gait recognition. For this purpose, smartphone-based accelerometers and gyroscopes are used to capture gait data continuously in the background, but only when an individual walks. Later, the system analyzes the recorded gait data and establishes the identity of an individual [3] [4].
An advantage of using the gait modality is that it can be linked with characteristics such as unobtrusiveness, effectiveness from a distance, and non-vulnerability, as it is difficult to continuously manipulate one’s own gait [5].
Smartphone sensors
The sensor is a device that detects and measures the changes in the nearby environment and sends that data to the operating system or processor. They sense and collect data for which they are made. Smartphones are intelligent due to their connection to a vast network of information and sensors, which enable accurate monitoring of movement and changes in the environment. This allows for effortless information searching and the use of various applications, such as games and weather apps.
Data Analysis
Dataset For Real-life Human Activity Recognition
A public-domain dataset for Real-life Human Activity Recognition Using Smartphone Sensors has been used for the scope of this article [6]. The information in the dataset is the measurements from the accelerometer, gyroscope, magnetometer, and GPS of the smartphone. The original scope of the data is to train the algorithm to distinguish between different activity types, but the same data can be also used to distinguish between users. We select ten users (user IDs: 1, 2, 5, 6, 7, 8, 9, 10, 11, 16) with sufficient data coverage for our analysis. There were four types of activities performed, but because of simplicity and the best data coverage, we limited our analysis to the ”Walking” activity [6].
In this research, we limit our analysis to accelerometer and gyroscope observations. These sensors can be employed in Android applications for continuous monitoring without the user’s permission, thereby making implicit authentication more accessible.
Experimental Setup
Python 3.9 was used for all computer calculations in this article. The following Python modules were also installed: Pandas, Numpy, SciPy, Scikit-learn, Seaborn, and Matplotlib.
Dataset Cleaning and Preprocessing
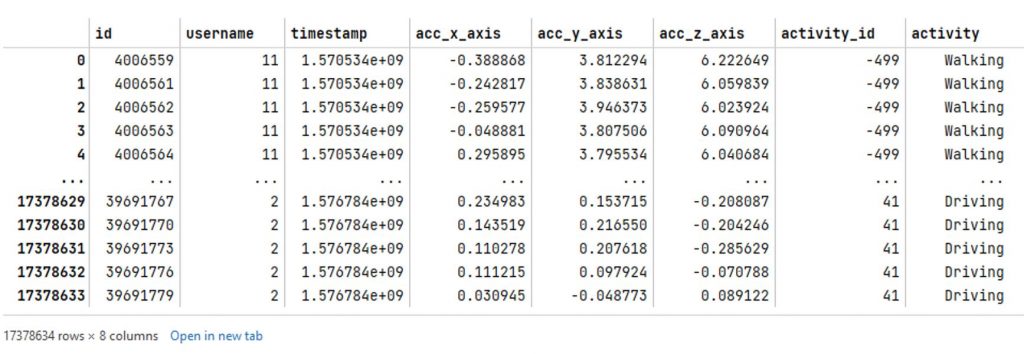
The raw sensor data from CSV files has been successfully imported into Pandas DataFrames. Tables 1 and 2 show the data in Pandas DataFrame form.

Data Resampling
It’s important to note that the gyroscope dataframe has 3242321 rows, while the accelerometer dataframe has 17378634 rows. This is a significant difference of 2.27 times in the number of rows (or samples) between the two sensors. In order to address discrepancies in the number of samples between accelerometer and gyroscope datasets, the accelerometer data underwent a resampling process. The goal of this process was to align the sampling frequency of the accelerometer data with the gyroscope data by interpolating new values at appropriate time intervals.
Linear interpolation was used to correct the differences and ensure a uniform sampling rate across both datasets. This procedure was essential in terms of maintaining data consistency and integrity, as it allowed the accelerometer data to align accurately with the gyroscope data in terms of sample distribution and frequency.
Training and Testing Datasets
The goal was to create a method for distinguishing individuals within a group. To ensure validity, a machine learning model was trained on 75 % of the data, teaching it to recognize the walking patterns of users. The remaining 25 % was used as a test set to impartially evaluate the model’s accuracy on new data, ensuring that it could be applied in real-world scenarios.
Feature Engineering on Time-Series Data
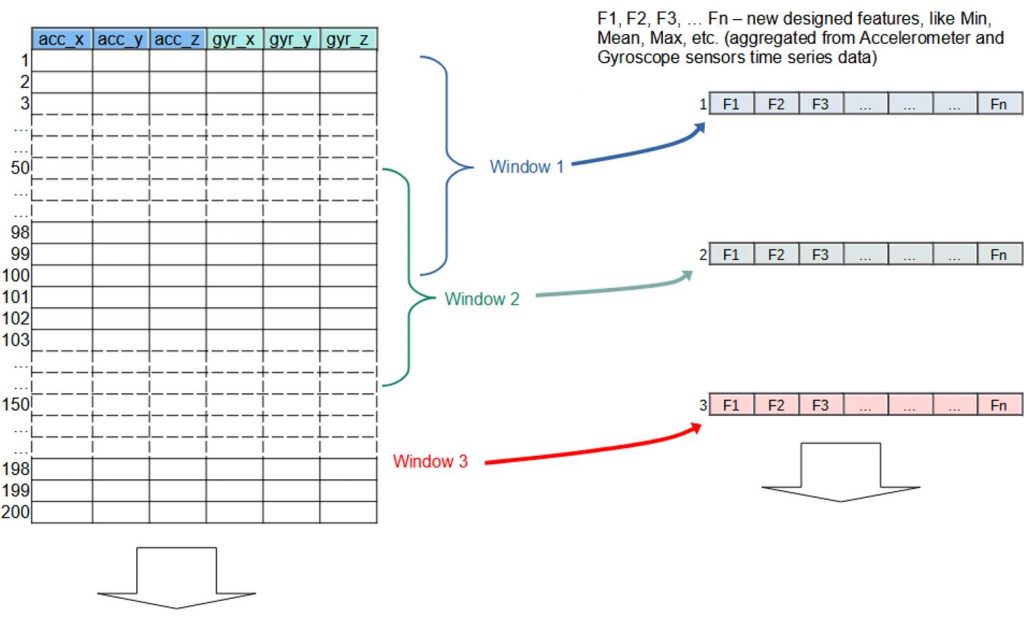
To improve machine learning model analysis, time-series data obtained from sensors such as accelerometers and gyroscopes undergoes feature engineering. This technique involves dividing the data into overlapping 20-second windows, as illustrated in Figure 1. This process ensures data continuity and enables each segment to contain relevant pattern information from the preceding one.
The complete list of statistical features employed in this feature engineering process includes:
- Min: Smallest value in the window.
- Max: Largest value in the window.
- Difference of maximum and minimum values: The range of values within the window.
- Mean: Average of the values.
- Average absolute deviation: Measures the dispersion of data.
- Standard deviation: Measures how spread out data is from its average value.
- Median: The middle value when data is arranged in order.
- Median absolute deviation: This measure is calculated by finding the median of the absolute deviations from the median of the data.
- Interquartile range: Range between the 25th and 75th percentile.
- Negative count: Number of values below zero.
- Positive count: Number of values above zero.
- Values above mean: Count of values that are greater than the mean.
- Skewness: Measures the asymmetry of the data distribution.
- Kurtosis: Quantifies the degree of heaviness or thickness of the tails of a probability distribution.
- Number of peaks: Indicates data’s variability.
- Energy: Total energy (mean of sum of squares of the values) of the signal.
- Average resultant: Average magnitude of the vector sum of its components.
- Signal magnitude area: Represents the total area under a signal.
After applying the windowing technique, the number of unique user IDs was reduced to 5 as the window was labeled with the most frequently occurring ID (1, 5, 7, 8, 9).
Classification Methods
In this study, three classification models adapted for time-series data derived from smartphone-based accelerometers and gyroscopes are presented. Two primary goals are aimed to be achieved by this analysis: identifying the most fitting model and tuning approach for the dataset and understanding the impact of hyperparameter adjustments on model performance. Hyperparameters define the model structure and complexity. The aim is to optimize the parameters in a way that maximizes the model accuracy but prevents overfitting. Overfitting refers to the situation, where the model becomes too complicated and starts to memorize the training data, which is seen as a weaker performance with the test data. We use GridSearchCV to perform an exhaustive search through a predefined parameter grid and select the combination with the best cross-validation score.
Logistic Regression
Logistic Regression (LR) is a commonly used binary classifier, but it can also be adapted for multi-class problems, as done in this study. The LR model estimates the probability of class memberships, and its performance was evaluated using default settings. Additionally, GridSearchCV optimization was performed, which led to improvements in accuracy and precision-recall balance.
Random Forest
Random Forest (RF) captures complex data patterns using an ensemble of decision trees. It outperforms LR in non-linear scenarios but requires more computational resources. The performance of RF was slightly improved after GridSearchCV optimization.
Gradient Boosting Machine
The Gradient Boosting Machine (GBM) is an ensemble learning method that iteratively corrects errors from previous weak learners and is highly effective for both classification and regression tasks. In this project, GBM models were evaluated with both their default parameters and after being optimized using GridSearchCV. Interestingly, the optimized version was marginally outperformed by the model with default parameters, indicating that significant performance gains do not always result from hyperparameter tuning.
It is important to note that GBM was found to be the most computationally intensive model among those tested. Specifically, the GridSearchCV optimization process took several hours on the computer utilized for this project, emphasizing the need for powerful computing resources when working with such complex algorithms.
Applied Machine Learning Models and Results
Among all the models evaluated, the most effective one for this study turned out to be LR with GridSearchCV. This model was able to balance performance and computational efficiency very well. The table 3 provides a comparison of model performance metrics.
| Model | Accuracy | Precision | Recall | F1-Score |
| LR (default) | 0.9220 | 0.9176 | 0.9172 | 0.9145 |
| LR (GridSearchCV) | 0.9238 | 0.9248 | 0.9226 | 0.9209 |
| RF (default) | 0.9074 | 0.8960 | 0.8786 | 0.8843 |
| RF (GridSearchCV) | 0.9165 | 0.9025 | 0.8909 | 0.8943 |
| GBM (default) | 0.9256 | 0.9227 | 0.9021 | 0.9083 |
| GBM (GridSearchCV) | 0.9183 | 0.8986 | 0.8937 | 0.8943 |
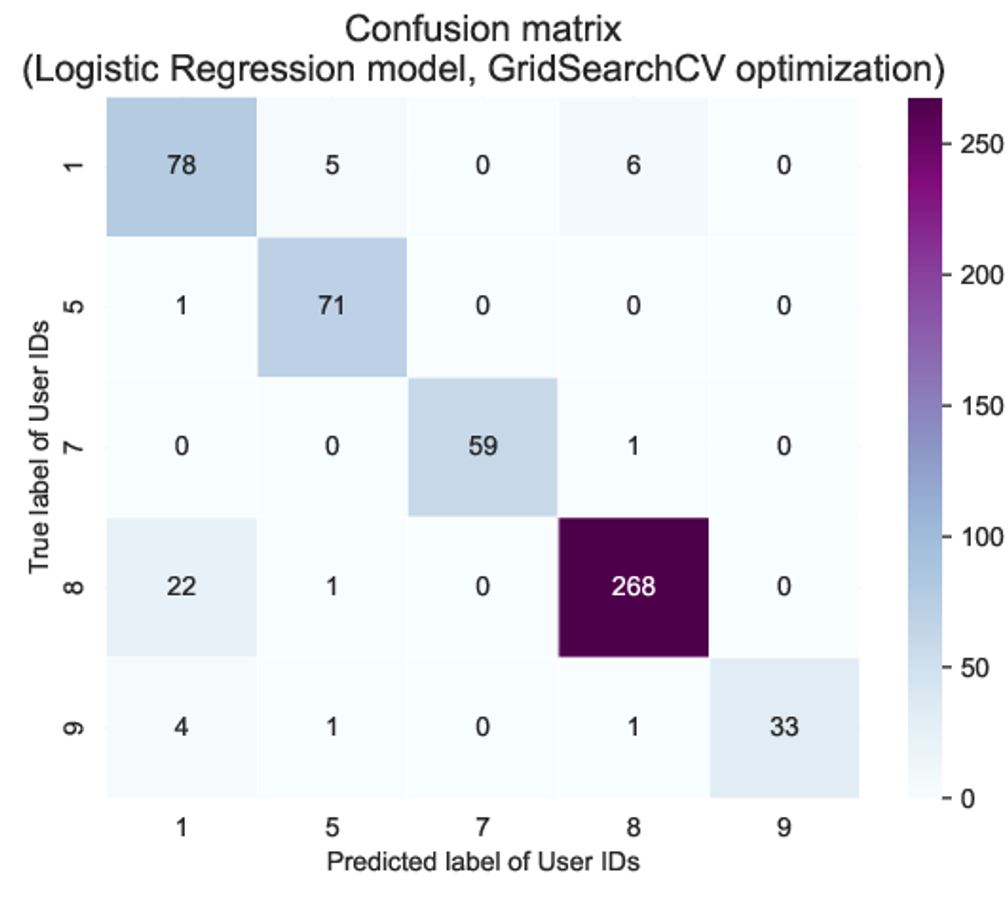
The LR model with GridSearchCV optimization is showcased in Table 4. Figure 2 shows the confusion matrix of model results, where the vertical/horizontal axis depicts the true/predicted labels (user IDs) from the test dataset, and colors and corresponding numbers show the number of cases for each combination. One should note that the dataset imbalance is obviously seen in the confusion matrix. User 8 appears 5−10 times more often than other users, which is seen as a larger number of both successful and failed classifications, but the overall model performance for user 8 is not significantly different from other users.
| ID | Precision | Recall | f1-score | Support |
| 1 | 0.7429 | 0.8764 | 0.8041 | 89 |
| 5 | 0.9103 | 0.9861 | 0.9467 | 72 |
| 7 | 1.0000 | 0.9833 | 0.9916 | 60 |
| 8 | 0.9710 | 0.9210 | 0.9453 | 291 |
| 9 | 1.0000 | 0.8462 | 0.9167 | 39 |
| Accuracy | 0.9238 | 551 | ||
| Macro avg | 0.9248 | 0.9226 | 0.9209 | 551 |
| Weighted avg | 0.9314 | 0.9238 | 0.9257 | 551 |
The relatively similar performance of different models indicates that already straightforward logistic regression can capture the necessary information to detect the user using parameters derived from accelerometer and gyroscope observations.
Final Takeaway
The integration of security with user experience will be seamlessly achieved in the future. To accomplish this, a balance between computational efficiency, model interpretability, and performance is crucially needed. LR model with GridSearch has been recognized as a strong contender because of its combination of speed, simplicity, and effective performance. For real-time applications like BB, secure system maintenance and prevention of compromise require quick and accurate user authentication. The user experience is enhanced while security is bolstered by this frictionless authentication method. Customers are not required to perform any specific actions as their natural walking behavior is sufficient to confirm their identity. A secure and user-friendly authentication system is provided by the fact that it is challenging to mimic or replicate another person’s unique gait.
It’s important to note that many sophisticated models often require well-curated data to function at their best. However, in real-world scenarios, such pristine data is a luxury that is not always feasible. The ability of the model developed in this work to deliver appreciable results on unprocessed data makes it suitable for practical applications where data preprocessing might be limited or even undesirable.
Ilpo Virtanen
Principal Lecturer, Data Analytics
School of ICT and Business
Oulu University of Applied Sciences
Vitali Samurov
Senior Imaging Software Engineer
AAC Technologies
The article is based on the thesis:

Samurov, V. 2023. Gait analysis as a prominent behavioral biometric modality for customer authentication purposes. Oulu University of Applied Sciences. The Degree Programme in Data Analytics and Project Management. Master Thesis. https://urn.fi/URN:NBN:fi:amk-2023111429341
References
[1] Gillis, A. S., Loshin, P. & Cobb, M. 2021. Biometrics. Search Security. Accessed 16.11.2023. https://www.techtarget.com/searchsecurity/definition/biometrics
[2] Bai, G. & Sun, Y. 2019. Application and research of MEMS sensor in gait recognition algorithm. Cluster Computing 22 (Suppl 4), 9059–9067. Accessed 16.11.2023. https://doi.org/10.1007/s10586-018-2062-x
[3] Zeng, X., Zhang, X., Yang, S., Shi, Z. & Chi, C. 2021. Gait-Based Implicit Authentication Using Edge Computing and Deep Learning for Mobile Devices. Sensors 21 (13), 4592. Accessed 16.11.2023. https://doi.org/10.3390/s21134592
[4] Muaaz, M. & Mayrhofer, R. 2017. Smartphone-Based Gait Recognition: From Authentication to Imitation. IEEE Transactions on Mobile Computing 16 (11), 3209–3221. Accessed 16.11.2023. https://doi.org/10.1109/TMC.2017.2686855
[5] Khamsemanan, N., Nattee, C. & Jianwattanapaisarn, N. 2017. Human Identification From Freestyle Walks Using Posture-Based Gait Feature. IEEE Transactions on Information Forensics and Security 13 (1), 119–128. Accessed 16.11.2023. https://doi.org/10.1109/TIFS.2017.2738611
[6] Universidade Da Coruña. Public Domain Dataset For Real-life Human Activity Recognition Using Smartphone Sensors. El Laboratorio de Bases de Datos. Accessed 16.11.2023. https://lbd.udc.es/research/real-life-HAR-dataset

Vastaa
Sinun täytyy kirjautua sisään kommentoidaksesi.